Better Amazon Aggregate Data to Understand True Competitive Metrics
Our mission at Momentum Commerce is to be the most respected data-driven consultancy in ecommerce, and part and parcel to that goal is developing better ways of analyzing the marketplace and how individual brands can assess their standing. In practice, that means turning business questions into data questions, which can be clearly answered via careful analysis.

The data science and engineering team (DSE) took this mindset to heart when developing our deep aggregate analyses for Amazon, which we’re now utilizing across our client base. Overall, we focused on producing insights based on individual products’ competitive set and individual search terms. This is in contrast to relying solely on Amazon’s categorization, which can be unreliable.
The search-term centric approach has a few benefits. By tracking this more discrete competitive set for each and every ASIN, it’s much easier to properly gauge how a given product compares with others a consumer is most likely to see alongside it. These more contextual measurements can more clearly justify price changes, advertising on new terms, or the relative need for other promotions to jumpstart sales across the site.
Additionally, as these aggregate comparisons capture a moment in time, tracking the rates of change help a brand visualize the changing nature of its competitive set or evolving consumer behavior.
Key Observations
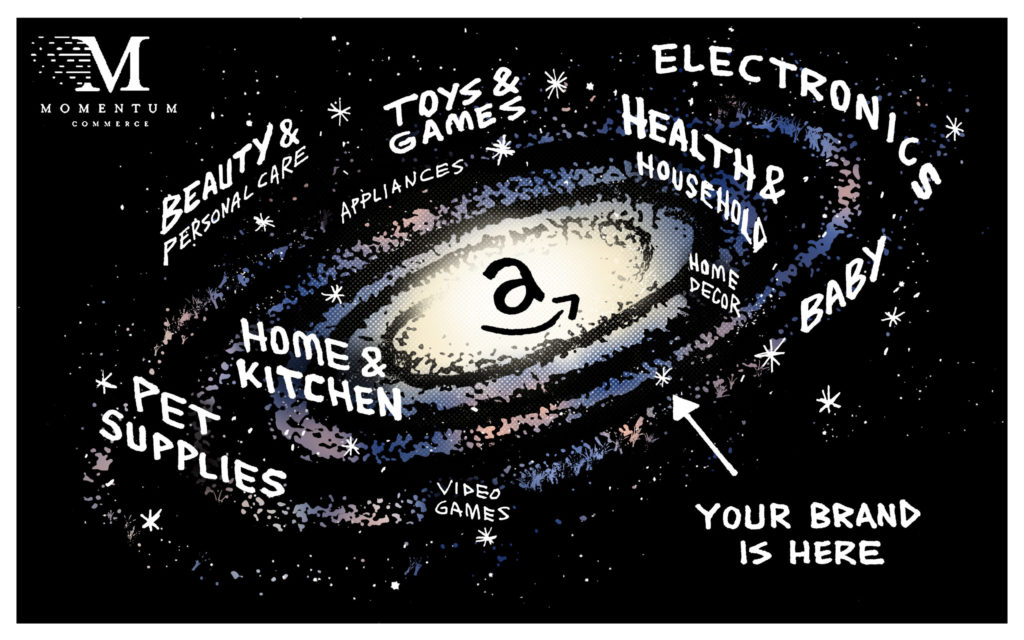
- Even within a given subcategory, a given product’s “competitive universe” can be significantly different from others on Amazon
- To confidently make tactical and strategic decisions, it’s important to have a deep understanding of the search terms, unique competitive set, and benchmark digital shelf elements for each ASIN
- Because Amazon changes so rapidly, tracking these metrics over time helps identify true progress vis a vis the closest competitors to a given ASIN
Amazon Search Term Analysis
A common question we hear from our clients is “what search terms should we be paying attention to?” either due to underinvestment or a ‘blind spot’ in coverage. Turning this question into a data problem, means getting a full, comprehensive view into not just where a given product is showing up on Amazon search (direct results), but also where the most closely related products are showing up as well (related results). For example, your brand’s solar powered outdoor lamp may not be showing up for searches for “landscape lighting”, but a high percentage of the ASINs alongside your product on other searches do – underscoring that this is a valuable, untapped related search term.
We’ve found these insights also provide a view into the general mindset of consumers as they are shopping for a given product category. When you look at the larger universe of related terms for that outdoor light in the example above, are they more related to generic terms around outdoor landscaping, home lighting, outdoor lighting, or very specifically to solar lights? This helps both when formulating an advertising strategy, but also when developing product content to support your product detail pages – you can more accurately pinpoint what motivates your likely buyers.
Amazon Competitor Analysis
Dovetailing off the prior analysis, we expose the specific ASINs most competitive with your own products within Amazon search pages, and catalog those over time. Layered into this view are metrics like price, how often the product ranks in the top three slots on the search page, and any additional discounts.
This can be particularly useful when analyzing how ‘entrenched’ a given competitor’s product is on key search pages, whether pricing may need to be changed to improve competitiveness, and when developing a competitor-focused PAT ad strategy on Amazon.
Amazon Aggregate Analysis
By marrying these data sources together, along with additional enrichment, we can help answer the question “how is my product performing on the digital shelf?” As a data problem, this includes breaking down a traditional share of voice (SOV) metric a number of different ways. This includes organic vs. paid SOV, and how those shift on the top 1K, 10K, 100K and 1M search terms on Amazon on a daily basis.
Additionally, on the pricing front, we examine how a client’s product is priced on a given day and compare that to the competition’s average across those same dates. To provide needed context, we express this figure both as a percentile (e.g. your product was in the 65th percentile for price vis a vis your competitors), and through standard deviations (e.g. your product’s price was 1.8 standard deviations away from the mean amongst that same competitive set). In this example case, while the percentile or raw figures may have a brand thinking they are competitively priced, the standard deviation figures underscore that they are well above much of average market.
We take the same methodology when it comes to both review counts and star ratings, providing a fuller picture of a product’s competitive set on these important metrics.
Finally, we also catalog Best Seller and Amazon’s Choice badging and Best Seller Rank (BSR), tracking how those change on a daily basis. For clients, this collective trove of data and subsequent analysis gives them real insight into what a typical best selling product looks like in their category – and how that may be shifting.
For example, we recently conducted a deep analysis for a client around ‘survivorship’ of Best Seller ranks and badging both amongst their products and their respective competitive set. What this showed was that BSR turnover is quite common – with products in the top 10 BSR only having a slightly better than 50/50 shot of still being top in the 100 a year later – but the client’s products were outperforming the market in this respect, helping validate their larger Amazon strategy.
If you’re curious about our approach or want to get these analyses for your brand, please shoot us a note here. Also, stay tuned for future posts where we utilize these aggregate analyses to give a comprehensive overview of individual categories on Amazon.


