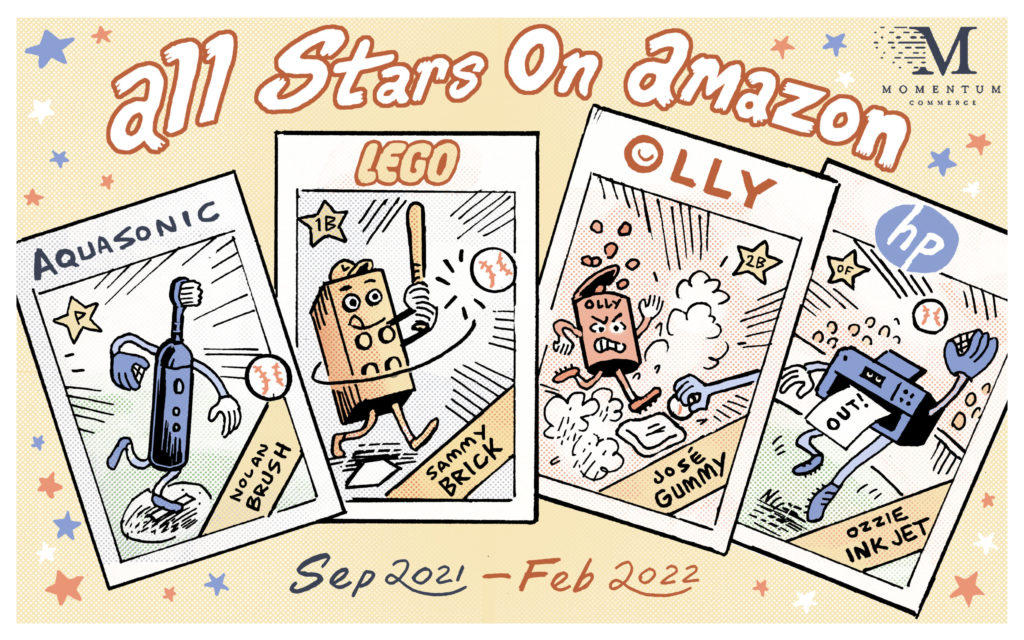
The Fastest Growing Brands on Amazon
What indicates true growth on Amazon is not just growing sales, but actually growing sales faster than the category at large – i.e. capturing market share. The challenge is that with the mix of well-heeled legacy brands and agile newcomers all selling on Amazon, every brand is facing competition encompassing a wide spectrum of potential strengths. Capturing market share in this environment is daunting, but possible. Below are the brands that have done the best job here, across some of the most popular categories on Amazon.
How We Calculated Amazon Market Share Change
The data itself is drawn from Amazon-specific sales figures cataloged by independent, third-party sources from September 1, 2021 through February 28, 2022. To better illustrate more sustained market share growth, market share figures were averaged from September through November, and then compared to the December through February average. Leaders are ranked based on the raw percentage point difference between the two periods.
Key Observations
- Over a six-month study period spanning September 2021 through February 2022, different Amazon categories demonstrated varying degrees of market share volatility
- Market share remains well distributed across a wide variety of brands in the Beauty & Personal Care, Clothing, Shoes & Jewelry, Health & Household, and Home & Kitchen categories
- Market share is much more concentrated across just a few brands in Electronics and Toys & Games
- Amazon Private Label brands expanded their leading market share in the Health & Household and Home & Kitchen categories
- Share of Voice is a leading indicator of market share gains on Amazon, and should be a critical metric to track for brands focused on growth
Beauty & Personal Care
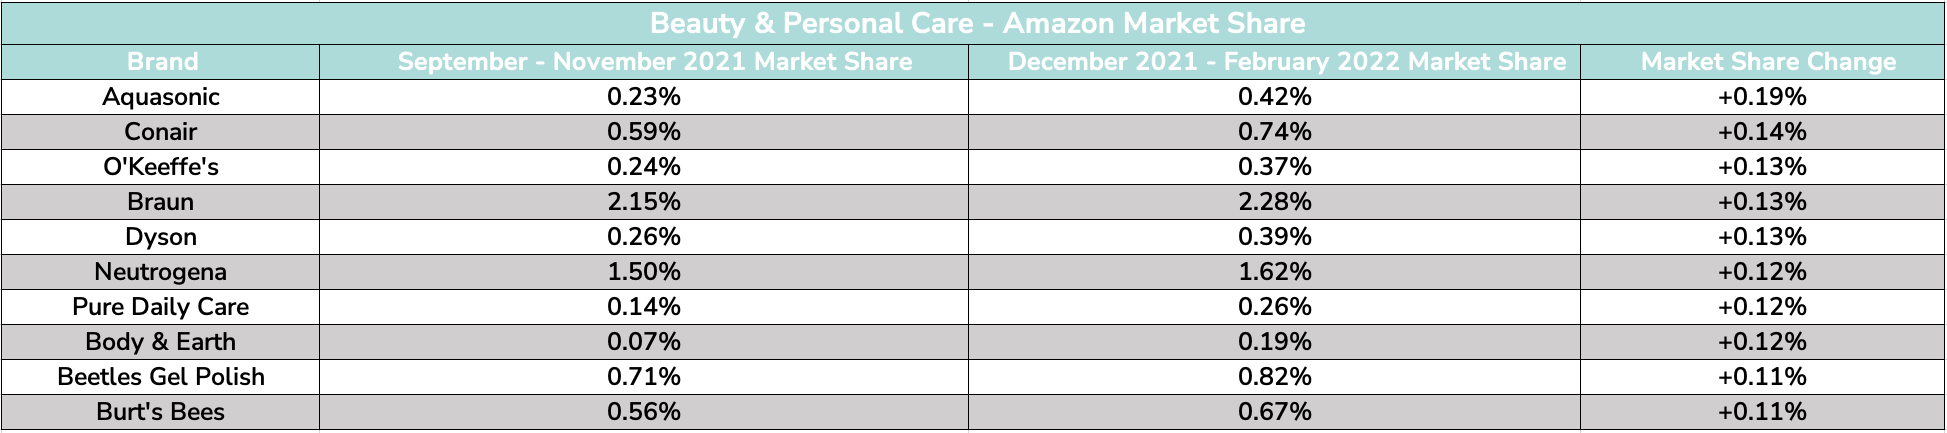
Underscoring the competitiveness of the category, the fastest growing brand in Beauty & Personal Care captured just under +0.2% of additional market share between the two study periods. Aquasonic’s rise in market share came at the expense of larger toothbrush brands Oral-B and Philips Sonicare, which posted market share decreases of -0.35% and -0.23% respectively – the second and third largest drops observed over the study period.
Clothing, Shoes & Jewelry
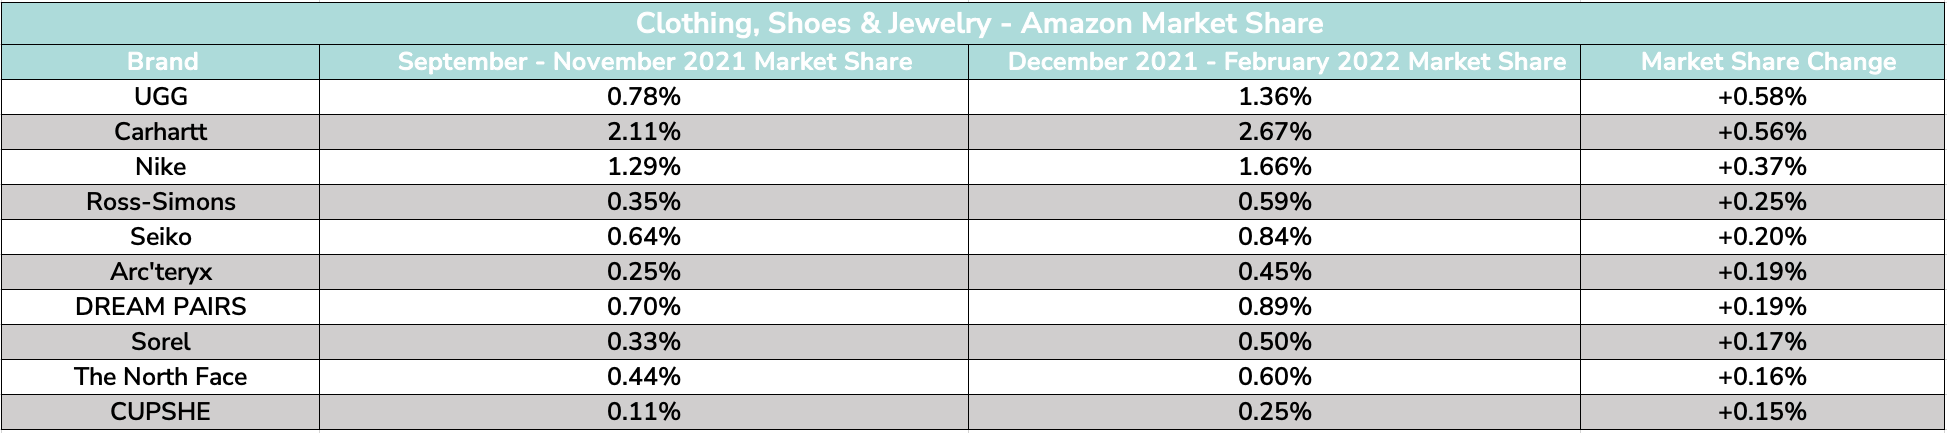
Reflecting the trends seen in our recent Share of Voice report on the Clothing, Shoes & Jewelry category, UGG grew its market share by +0.58% over the studied timeframe. Carhartt’s rise nearly matched UGG’s, and combined with Hanes’ -0.63% drop, gave the workwear brand the largest market share in the category over the December to February timeframe.
Health & Household
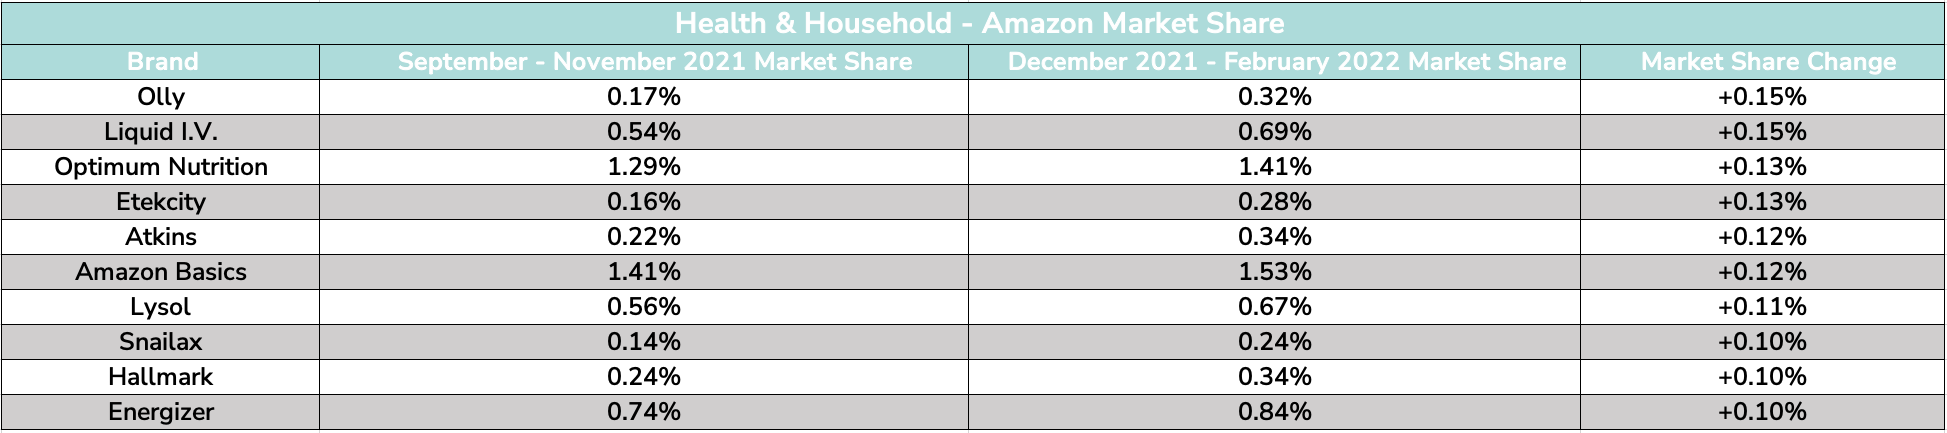
Vitamin brand Olly nearly doubled its market share between the two study periods, even across a large and wide-ranging category like Health & Household. New Year’s resolutions around health likely played a role, with Liquid IV and Optimum Nutrition also posting similar gains. Amazon’s private label brands continue to loom large in the category, grabbing an additional +0.12% market share even as the market leader within both periods.
Home & Kitchen
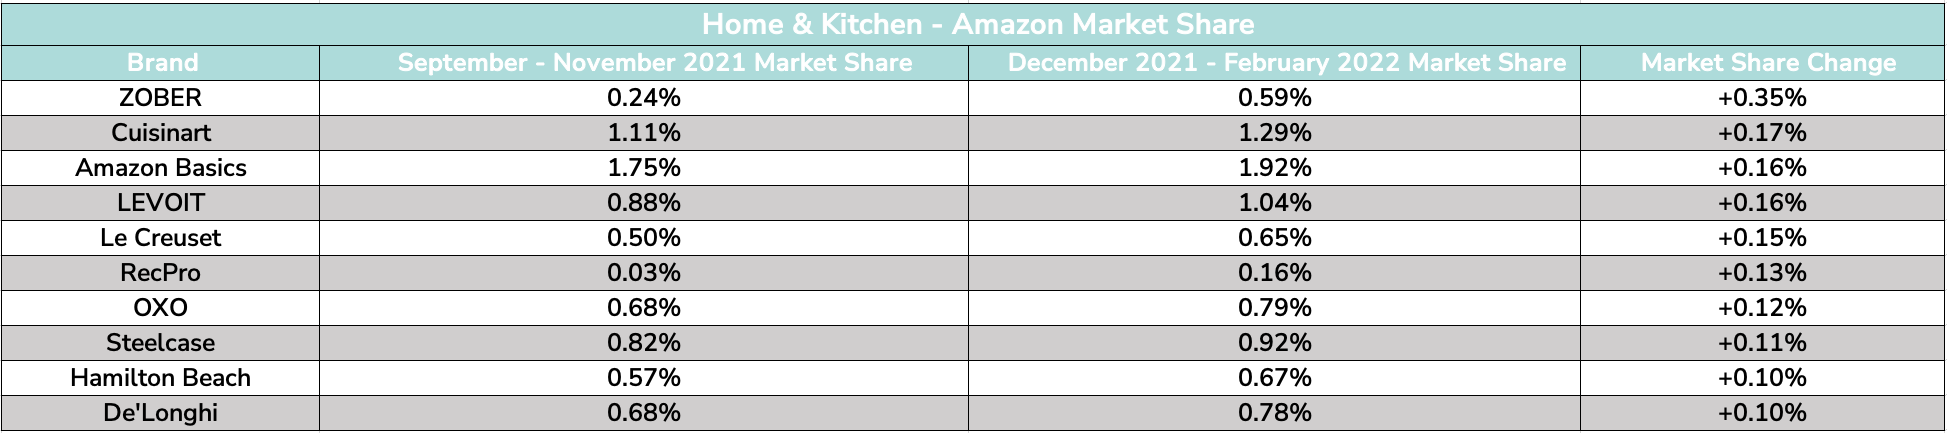
For certain brands, seasonality matters quite a bit. Zober is a great example in the Home & Kitchen category. The hanger and closet organizing company grew its market share by 0.35% – nearly 2X higher than the increase posted by the next fastest rising brand – thanks to booming January sales around the New Year. This is another category where Amazon’s private label brands stand out, partially due to breadth of products across the category, with Amazon Basics capturing an additional +0.16% market share over the study period.
Electronics
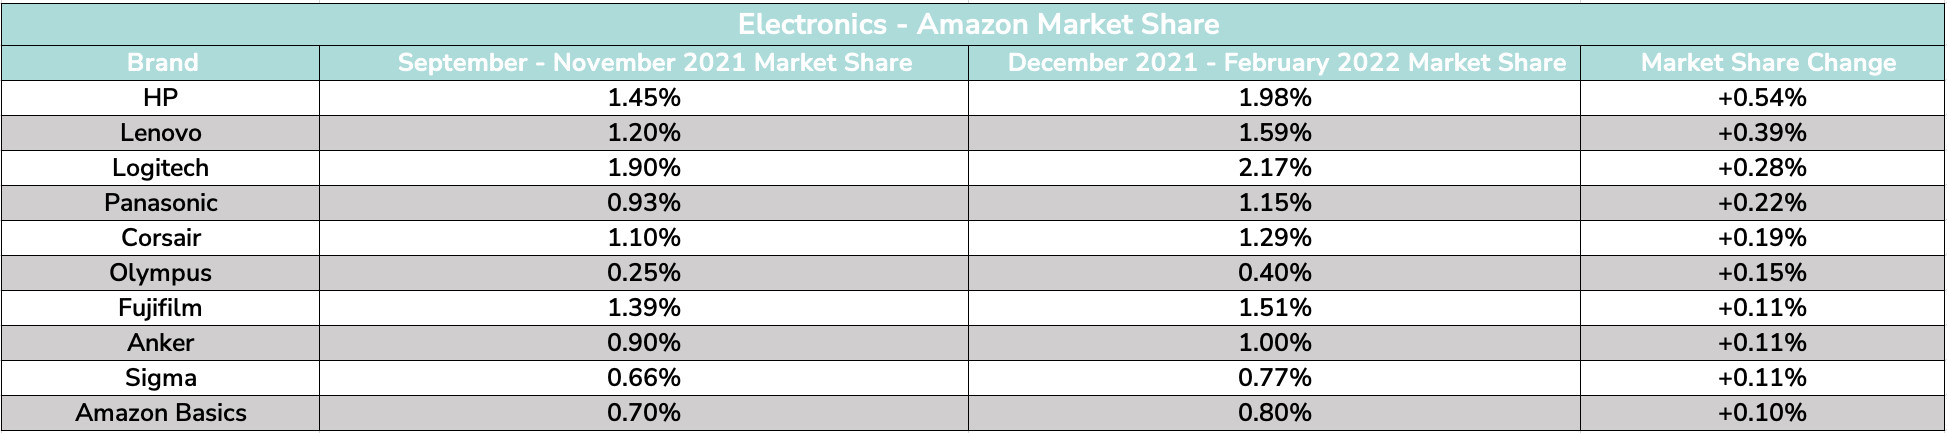
Compared to the above categories, Electronics market share is relatively concentrated. During the December to February timeframe, the top 25 brands captured 49.23% of all category sales. This is influenced by higher-priced computer and mobile phones naturally driving higher sales figures as compared to lower priced accessories. With HP, Lenovo and Logitech, it was some of those same larger players that drove the biggest market share increases over the six months studied.
Toys & Games
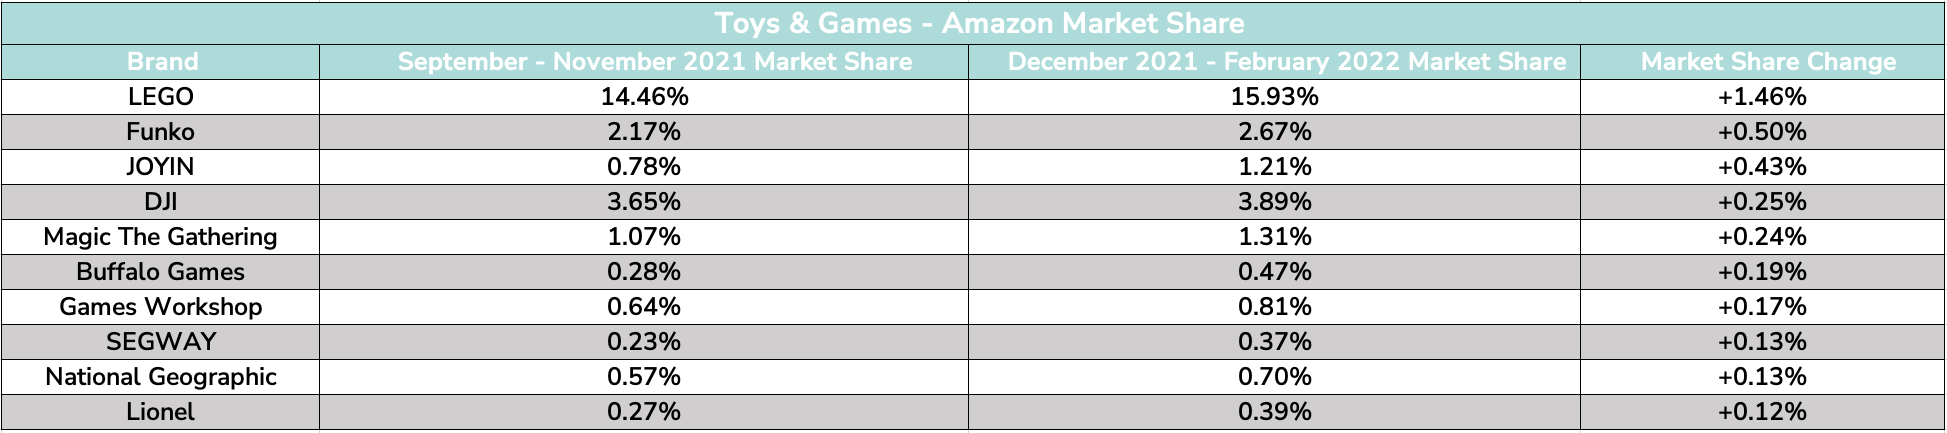
In the Toys & Games category, it’s LEGO, and then everyone else. Thanks to high brand affinity, higher price points, and new collections keeping customers coming back, LEGO captured an astounding 15.93% of all Toys & Games sales between December 2021 and February 2022 – an increase of 1.46% from the prior three month average. The next closest competitor, Funko, posted a 0.50% gain.
Final Thoughts on Amazon Market Share Growth
While gaining market share should be the main goal for any brand selling on Amazon, the path to driving those gains is tied to share of voice. In a recent webinar with Perpetua, we showed how there is a clear, positive association between share of voice and market share.
Bringing this down to the tactical and strategic level, you need to focus on defining terms that are meaningful for your business and individual products, what competitors are showing up on those terms and where, where your products rank on those same search results pages, and the value of certain slots on each search page (i.e. are consumers only converting on top-of-search or are sales more widely distributed down the page). Once you’ve answered these questions, and have a means to reevaluate them regularly, consistently driving share of voice increases will lead to market share increases as well.
If you’re curious about your brand’s share of voice or market share on Amazon, check out our free Amazon Brand Index tool, or shoot us a note at hello@momentumcommerce.com for a deeper, custom analysis.