DSE Insights: Prime Day 2021 Recap
Prime Day 2021 was one for the record books. According to Amazon’s data, 250 million items were sold across the period from June 21st to June 22nd, 2021, making this the biggest Prime Day in history. And according to Digital Commerce 360, the estimated Amazon sales for this period were almost $11.2 billion globally, which is a 7.6% increase from the two-day event in October 2020 that yielded just shy of $10.4 billion in global sales.
However, those sales were not evenly distributed, nor was ad spend or the sponsored positions of Brands. At Momentum Commerce, we often examine the concept of “Sponsored Share of Voice”, which equates to the percentage of the time a particular brand appears in the top 20 Sponsored placements for a keyword or basket of Keywords on Amazon. So, for Prime Day, we thought it might be interesting to examine how the Share of Voice breaks down among brands for different sub-categories within Electronics, since this is one of the primary discounted categories on Prime Day. We could use this to see which categories were the most top-weighted (one or a few brands dominating the share) versus ones where the SOV was less lopsided.
To do this, we examined Brand positioning for Sponsored placements throughout Prime Day (6/21 and 6/22) for the baskets of keywords that encompassed each sizable subcategory within Electronics that fell into the top Amazon search terms. For each of these categories, we were sure to also include keywords associated with any child categories. For instance, for Headphones, we combined any keyword classified specifically into Headphones with its child categories (e.g. Earbud Headphones, On-Ear Headphones, Over-Ear Headphones). To assess the degree of top brand dominance, we computed a metric called the Gini coefficient on each category, based on each Brand’s Share of Voice. Gini is most commonly used in economics as a measure of income inequality. A country with all of the wealth held by one person would approach a Gini coefficient of 1, while another country where wealth is completely evenly spread across all of its citizens would have a Gini coefficient of 0. In this case, we simply replace citizens with Brands and wealth with Sponsored Share of Voice, but the concept is the same. The higher the Gini, the more total Share of Voice is held by the top brands. Below, you can see each category (very small ones are omitted), ranked from Highest (most lopsided) to lowest (least lopsided) Gini, as well as the top 3 brands for Sponsored Share of Voice for each category.
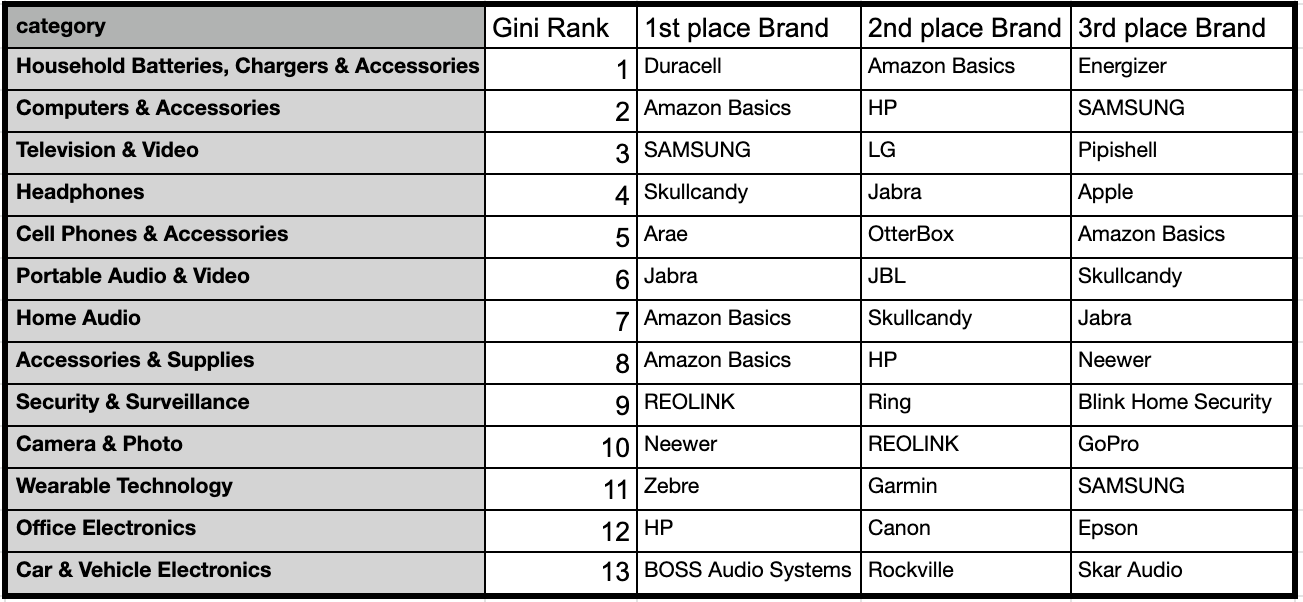
As can be seen above, “Household Batteries, Chargers & Accessories” has the highest Gini in the Electronics category, and is dominated by Duracell, which holds around 33% of the total SOV by itself. Conversely, “Car & Vehicle Electronics” has the lowest, with Boss Audio Systems, Rockville, and Skar Audio combining for only around 10% of SOV. If we examine these two categories, below we can see the Sponsored top 20 SOV from each of the top 3 brands, as well as the cumulative SOVs for top 10 and 25 brands.
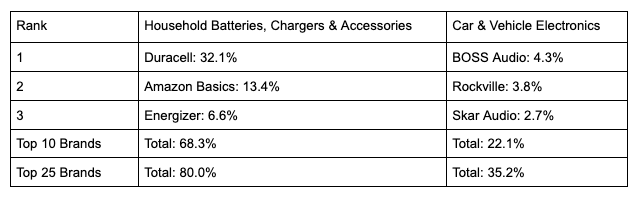
As can be seen above, the top 25 brands hold 80% of the Sponsored top 20 SOV in Batteries, but only 35.2% in Car & Vehicle Electronics. However, this above table exaggerates the differences, as there are far more brands in the Car & Vehicle Electronics category than the Batteries category (so Duracell having 32%, though dominating, is less dominating than it would be if it held 32% in Car Electronics). When we compute Gini, we actually look at what cumulative share of total SOV is encompassed within the top brand percentiles, and below you can see how this compares for the two categories.
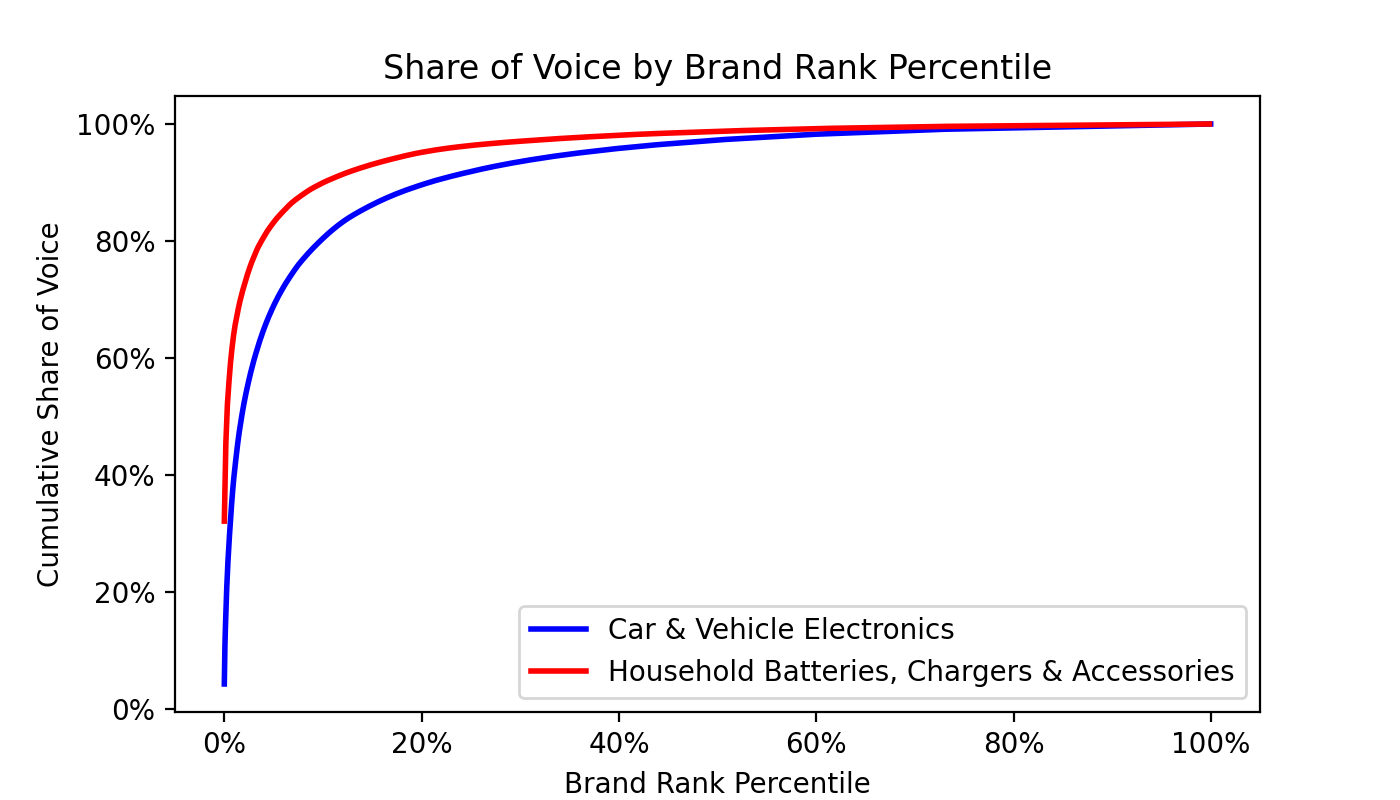
In both cases, the top few brands hold the lion’s share, but the curve is quite a bit sharper for Batteries, where the top 5% of brands hold 83% of total share, versus only 65% on Car Electronics, meaning that Batteries is a much more lopsided market than Car Electronics.
So, what can be done with this information? In general, a higher Gini means more share is compressed within a few players, whereas a lower Gini indicates more of an even playing field. It can be easier to move up the ranks in categories with less singular brand dominance, so finding categories with lower Gini scores can be important to maximizing your advertising spend.
The Momentum Commerce Data Science & Engineering Team (DSE) continuously monitors the above and other characteristics of the Retail Media landscape. For any questions on our findings, request for analysis in your specific category or topic suggestions for future analysis, please reach out to Momentum Commerce at hello@momentumcommerce.com.