How Market Share Correlates with Share of Voice on Amazon
When it comes to Amazon, brands generally view share of voice (SOV) and market share as inextricably linked. This makes it a common method for assessing performance relative to the market. But while this connection logically makes sense, Momentum Commerce has the data to answer the fundamental question of “is it true?” The answer is that there is a clear correlation between SOV and market share on Amazon, but the exact increase in SOV necessary to drive a 1% change in market share depends on category size, category maturity, and brand strength.
The Research
Momentum Commerce analyzed Amazon market share along with paid, organic, and total share of voice data across more than 50 categories between June 2021 and December 2022. A regression analysis was then performed across these data sets, incorporating total market size, brand assortment, and branded search term frequency on category search terms.
Questions investigated as part of the research included:
- How strongly does SOV predict market share for a brand?
- Is there a lag between SOV and market share that one could use to understand a drawdown-like effect?
- What other factors impact the relationship between SOV and market share?
- Is it possible to quantify a change in paid or organic share of voice relative to the cost to do so?
For each category, indices were then developed, to illustrate how a 1% increase in share of voice impacts Amazon market share gains for each brand in a category in comparison to one ‘baseline’ brand.
The Story
- Total SOV is a good predictor of market share, particularly for larger categories
- Organic SOV is a more meaningful predictor of market share in less-mature markets (i.e. categories exhibiting very positive CAGR)
- Paid SOV is a more meaningful predictor of market share in more-mature markets (i.e. categories exhibiting stable to negative CAGR)
- Increases in SOV impact Amazon market share with relatively little lag time (i.e. within the same month)
- Each category demonstrates differing degrees of relationships between SOV and market share. For example:
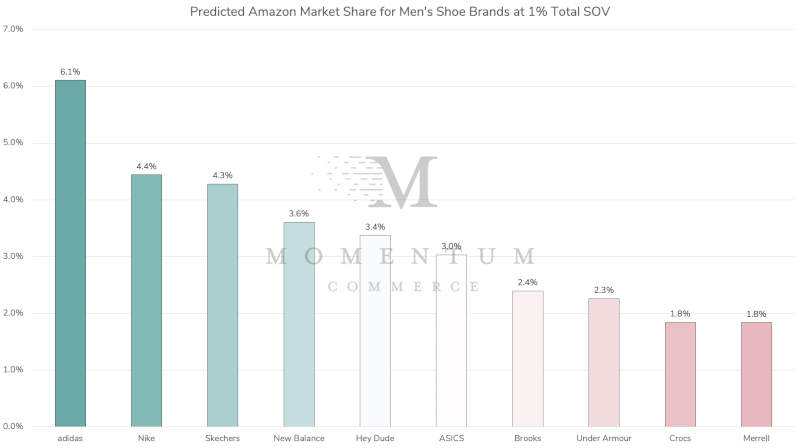
- In Men’s Shoes, a 1% increase in total share of voice drives an average 0.12% increase in share of market
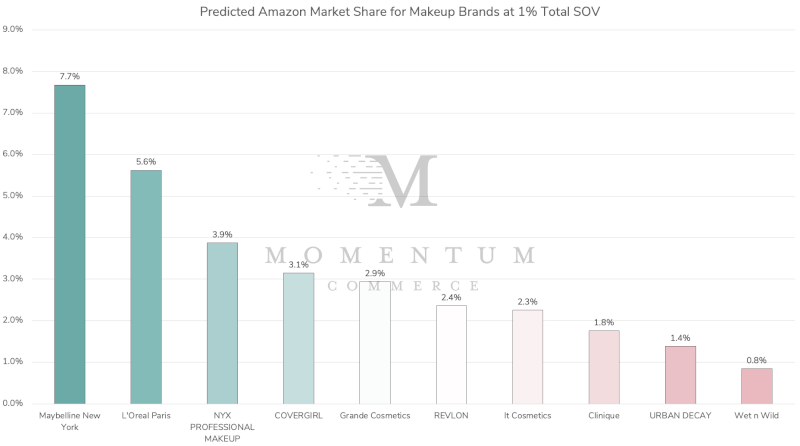
- In Makeup, a 1% increase in total share of voice drives an average 0.325% increase in share of market
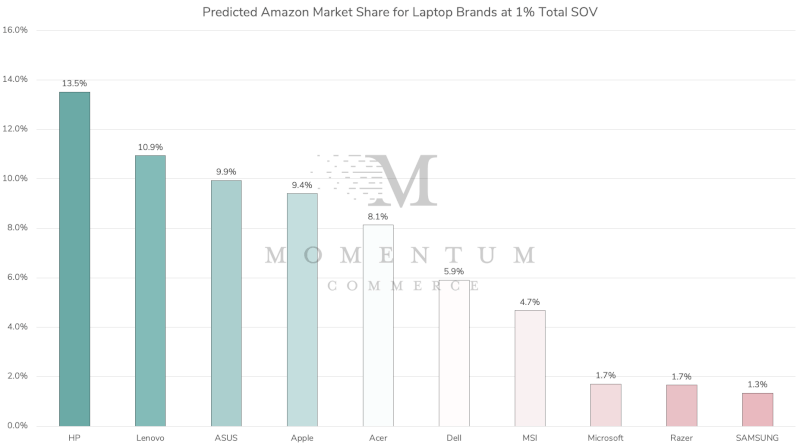
- In Laptop Computers, a 1% increase in total share of voice drives an average 0.17% increase in share of market
- However, the likely cost to drive a 1% increase in market share in any category rises or falls based on a number of factors, particularly a brand’s strength in the category as measured by relevant branded search volume
The Examples
To help illustrate how different brands have distinct advantages driving market share gains from SOV, the following graphs show the estimated market share of top brands if they only had a 1% SOV in their category.
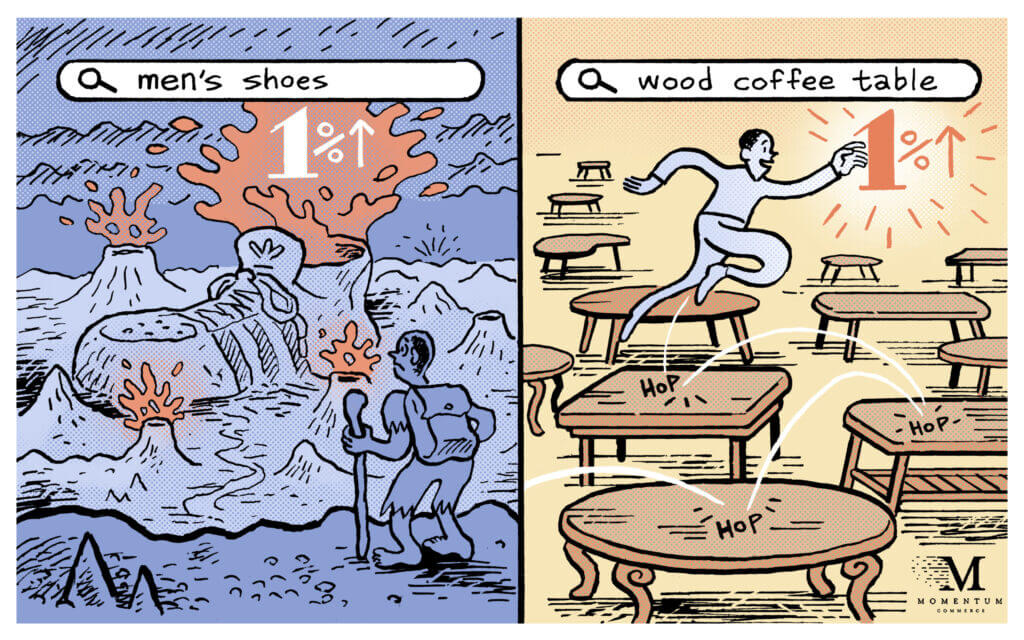
Men’s Shoes (less-mature, fast growing market)
Makeup (somewhat-mature, growing market)
Laptop Computers (mature, slightly declining market)
Biggest Takeaways for Brands
- Period-over-period losses in SOV need to be taken seriously, particularly when occurring across important or larger categories
- If you’re a smaller or newer brand in a more mature category, be prepared to spend significantly more than your top competitors in terms of driving market share gains through paid placements
- In less-mature categories, brands should take a decided focus on keyword research, pricing, and content optimization to help improve organic SOV in particular, but this is a lengthier process than improving paid SOV
- Understand your relative brand strength within a given category, along with ad saturation rates by using tools and data sources that track these types of metrics (one is the Momentum Commerce Insights Platform)
- Stay tuned to Momentum Commerce as we develop interfaces that help calculate the likely cost of market share increases for each and every brand across thousands of categories