Amazon Advertising up 87% YoY But Ad Rates Still Vary by Category
Amazon’s recent Q2 earnings call highlighted that advertising revenue is up 87% year over year relative to last summer. According to the same earnings releases, Amazon’s total net sales growth for the same period was only 27% – indicating that advertising costs are growing far faster than sales. As a result, brands need to be cognizant and informed about how to optimize their Amazon strategy to get their products listed in premium search locations.
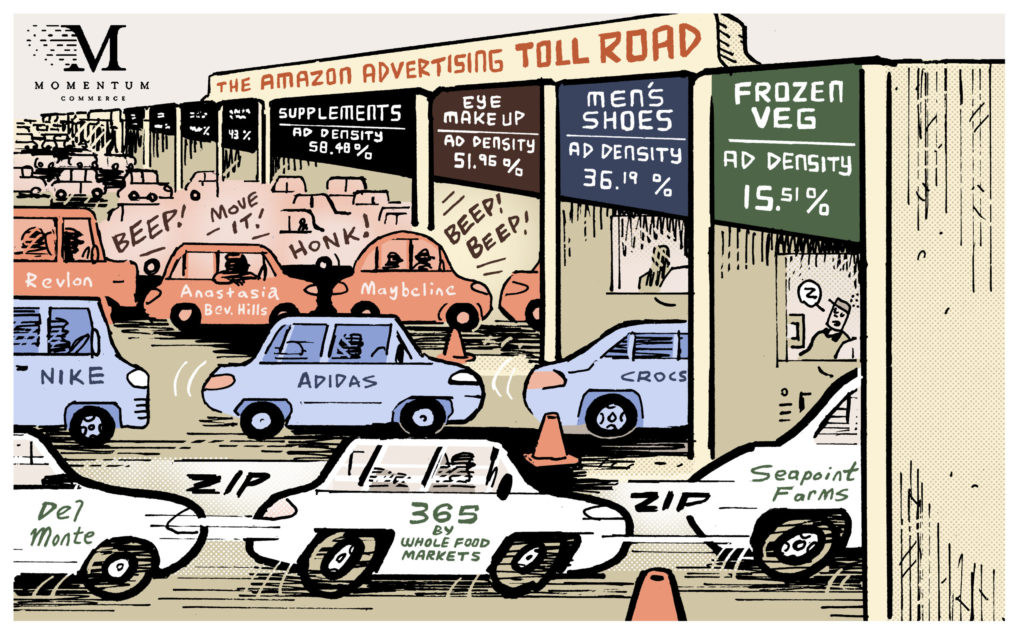
Though ad sales should continue to climb year over year on Amazon, the trend isn’t likely to affect all subcategories similarly. At Momentum Commerce, using our Amazon Brand Index tool, we can examine the prevalence of sponsored advertising vs organic free listings across all frequently searched terms in the Amazon marketplace. We call the proportion of listings that are sponsored for a search term “Ad Density”. This allows brands to quickly understand the degree to which sponsored product listings affect their category space and how other brands in their field approach advertising.
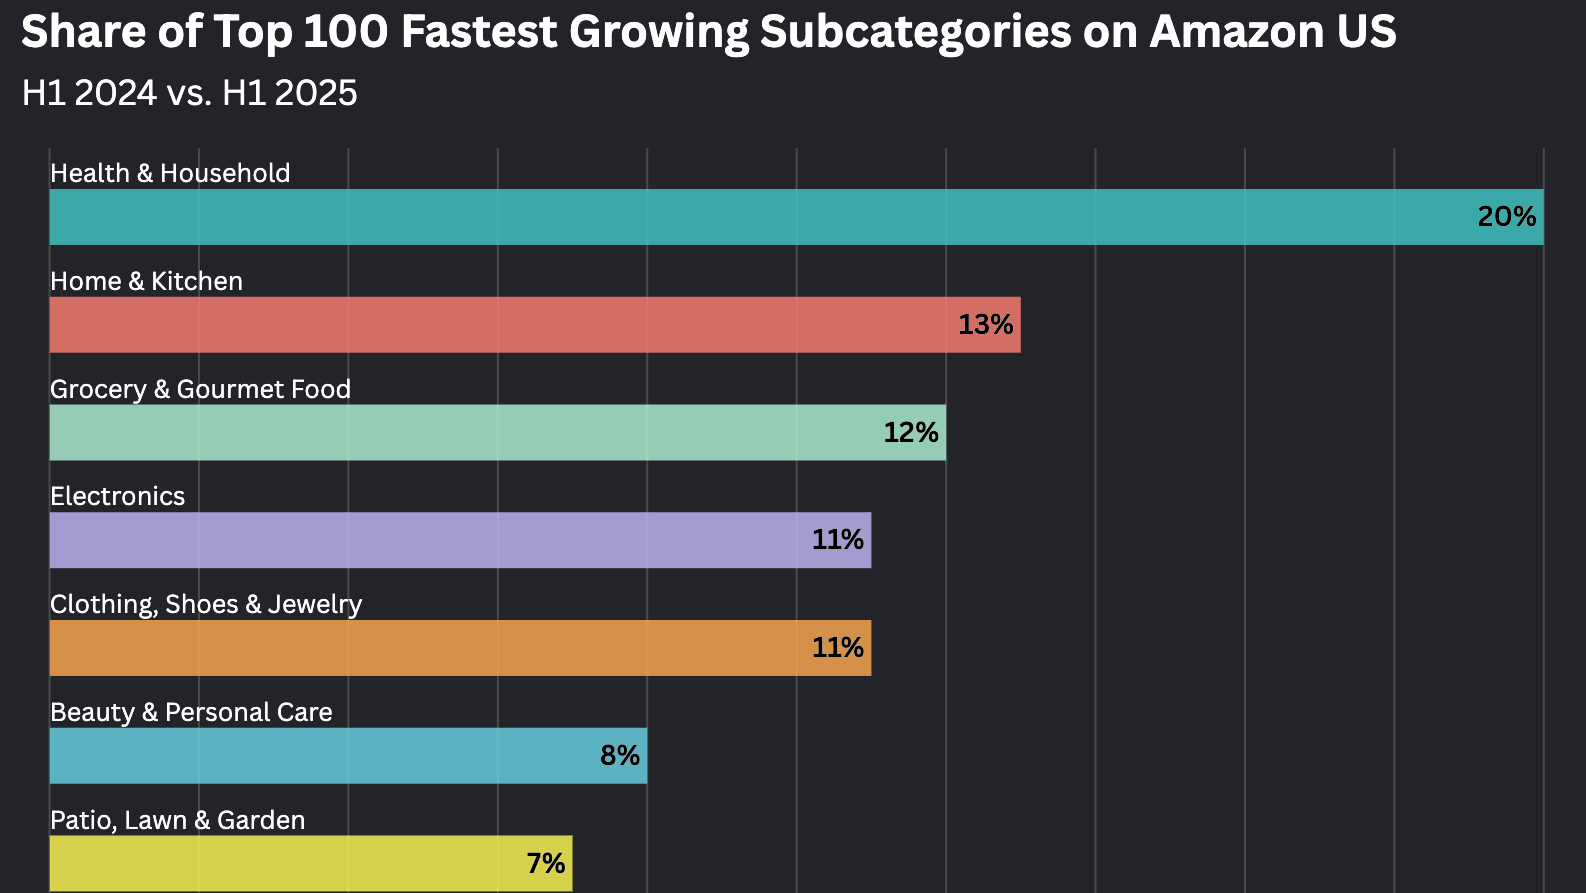
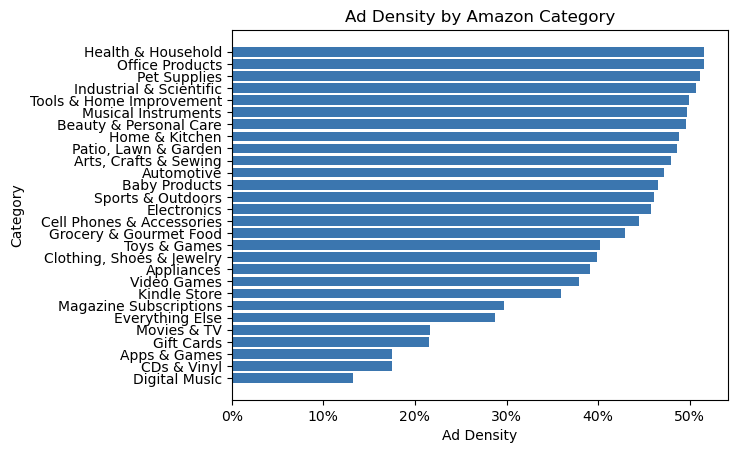
In addition to the search term level, we can aggregate this data across all major Amazon categories to get a better understanding for which categories and subcategories are more ad dense. Below, we examine the Ad Density for the top 10 listings across all top-level Amazon categories for the week of July 17 to July 23, 2021. We can see that certain categories, such as “Health & Household”, have an Ad Density of over 50%, meaning that on average over half of the top products that associate with search terms are sponsored. The “Toys & Games” category is less ad dense than “Health & Household”, but still returns around 40% of sponsored listings within the most frequently searched terms.
While it’s useful for a brand to know the competitiveness of their overall category, the actionable insights become more prevalent as we dive further into the Amazon taxonomy as it’s likely a brand is mostly concerned with a smaller portion of the overall category market.
Let’s take a further look into the search terms associated with the “Grocery & Gourmet Food” category. Currently, grocery-related search terms return an ad density of ~43%, which is fairly close to the Amazon overall average of 45%. But let’s go one level deeper into Grocery subcategories to see if their Ad Densities reveal potentially actionable insights for brands.

As seen above, Ad Density at the subcategory level begins to vary more. Certain product types such as “Snack Foods” and “Pantry Staples” have higher ad densities, signaling that results in these fields are more driven by ad spend than “Produce” products. By contrast, categories like “Dairy, Cheese & Eggs” or “Meat and Seafood” show sponsored listings less than 30% of the time.
Examining one step further into “Dairy, Cheese & Eggs” reveals a clearer polarization in the category. “Non – Dairy Milks” have a significantly higher ad density than the other dairy groups. A relatively low number of brands appear in the top results for associated search terms, but the results themselves are over 50% branded, suggesting a high level of competition for the “Non – Dairy Milks” search terms.

This shows that despite a lower number of players in the field, the premium listings, digitally equivalent to the brick and mortar end cap, are likely to be filled by sponsored listings. A brand looking to expand from traditional dairy milk to a non-dairy alternative would be wise to heed these findings and adopt a very different ad strategy for the products in the more competitive category. Currently, the top 3 brands in terms of advertising share of voice: Califia Farms, Silk, and Good Karma, the rightmost points on the below graph, combine for 40% of all paid placements in the category.

It’s important for brands to understand their own paid shares of voice for premium listings, how those relate to competitor brands in the same space, and how those values shift over time. However, the Amazon Brand Index also allows for a more holistic feel to identify the relative competitiveness of a given brand’s field.