2023 Amazon Holiday Trends for Health & Household: Category Sales Up 20.1%, Amazon Private Label Outflanking Everyone
This is the second in a series of category-specific recaps focusing on this past 2023 holiday season.
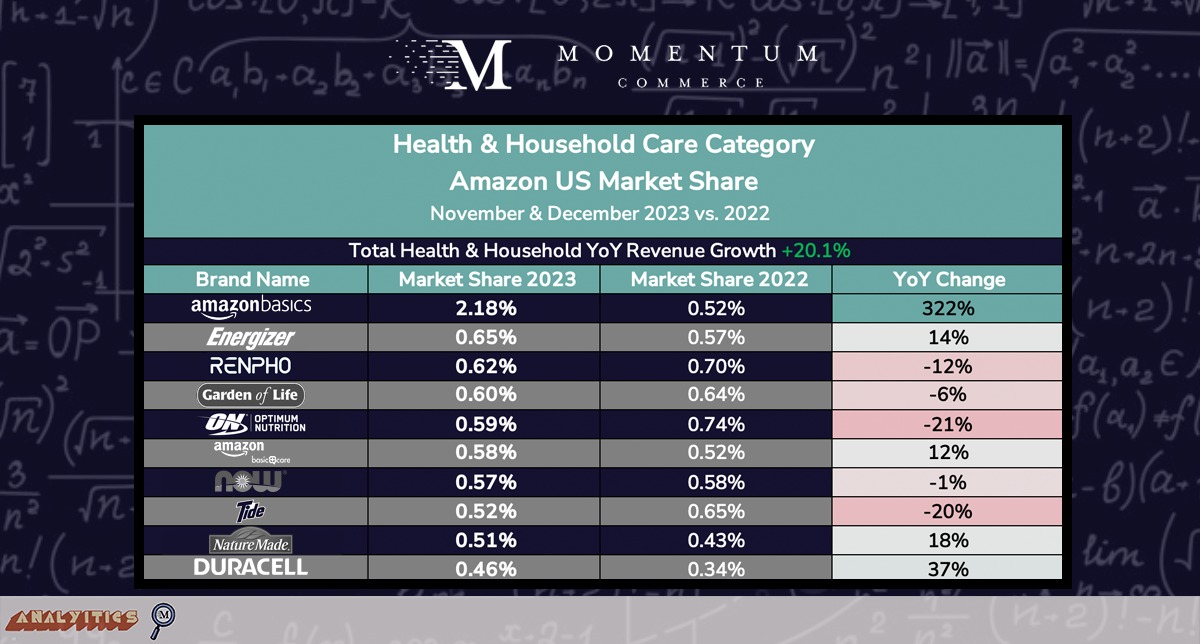
Over the course of November and December 2023, Health & Household category revenue increased 20.1% year-over-year (YoY) on Amazon US, moving from $6.1B to $7.4B. Amazon’s private label brands collectively were the biggest beneficiaries of this growth, with the collective market share captured by the Amazon Basics and Amazon Basic Care brands hitting 2.76% – up from just 1.04% one year prior (+167% YoY). This emphasizes how despite Amazon pulling back on its private label presence across categories like Home Goods and Clothing, it is increasing its private label investments within specific fast-moving consumer goods (FMCG) categories, posing unique challenges for competing brands.
Health & Household Amazon US Revenue & Market Share Trends
The vast majority of top brands within the Health & Household category hold very similar shares of total category Amazon US revenue. The second-best-selling brand (Energizer) has a market share just 0.19% higher than that of the ninth-best-selling brand (Duracell). The top brand in the category, Amazon Basics, remains a notable exception with a market share of 2.18% in November and December 2023 – a figure more than 3X that of second-place Energizer.
Not surprisingly, Amazon Basics’ market share grew substantially more than other top brands in the category despite overall category revenue also rising by more than 20% YoY. Across supplement brands, Garden of Life, Optimum Nutrition, and Now Foods all lost market share YoY while Nature Made increased its share by 18% – the third-highest increase in the category across top Health & Household brands.
Biggest Takeaways for Brands
Amazon Basics represents the proverbial 10,000lb gorilla in any subcategory where the brand is present – whether that’s batteries, toilet paper, or plastic sandwich bags. But beyond Amazon’s private label business, the wider YoY revenue increase and low degree of revenue concentration in top brands underscores how there remains a tremendous amount of opportunity for brands in this category that set focused, growth-minded strategies.
Health & Household Amazon US Paid Share of Voice Trends
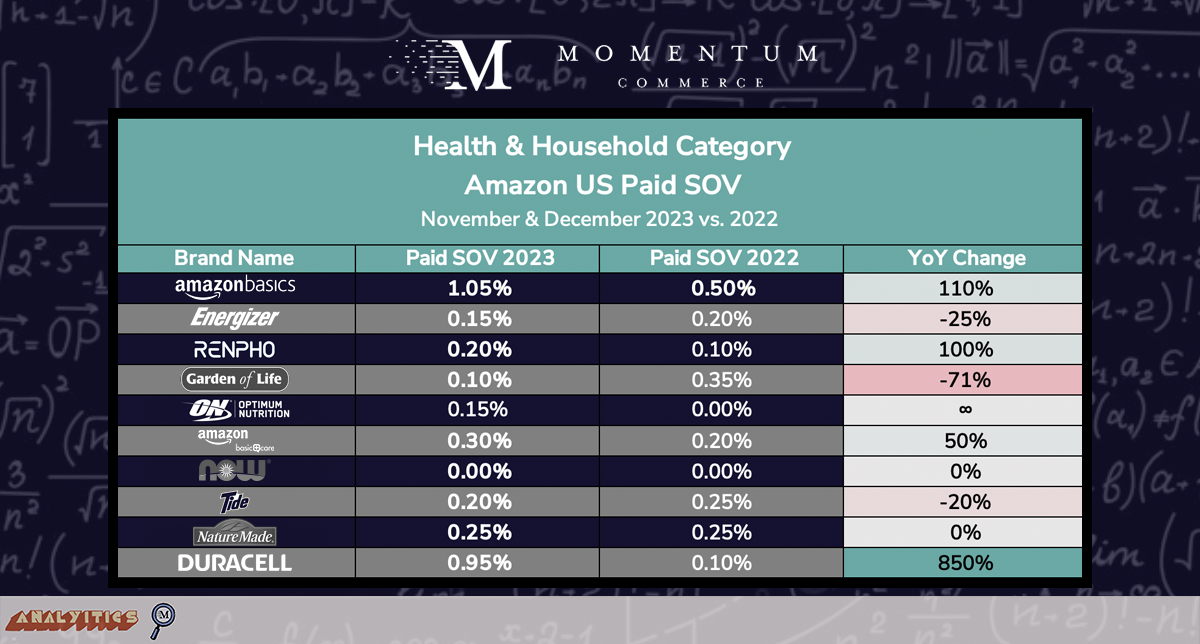
There was significant volatility in Paid SOV amongst top Health & Household brands on Amazon US over the holiday shopping period. Four of the top-10 brands more than doubled their Paid SOV YoY. Energizer was the only brand to see a Paid SOV decline but still drive a market share increase YoY. This indicates that the decrease in visibility was primarily across terms that were not critical to the brand’s overall revenue.
Biggest Takeaways for Brands
While searches across the Health & Household category include a brand name roughly 19% of the time, this varies wildly between subcategories. For example, roughly 11% of Vitamins & Dietary Supplements searches include a brand name, while that number jumps to 39.7% in the Baby & Child Care category. Particularly for larger Health & Household brands, improving sales and market share will come from identifying high-volume terms specific to each product based on marketplace dynamics, and then enabling bidding strategies based on differential value around relevance, cost, historical conversion rates, and a product’s existing, actual placement on the SERP.
Health & Household Amazon US Pricing Trends
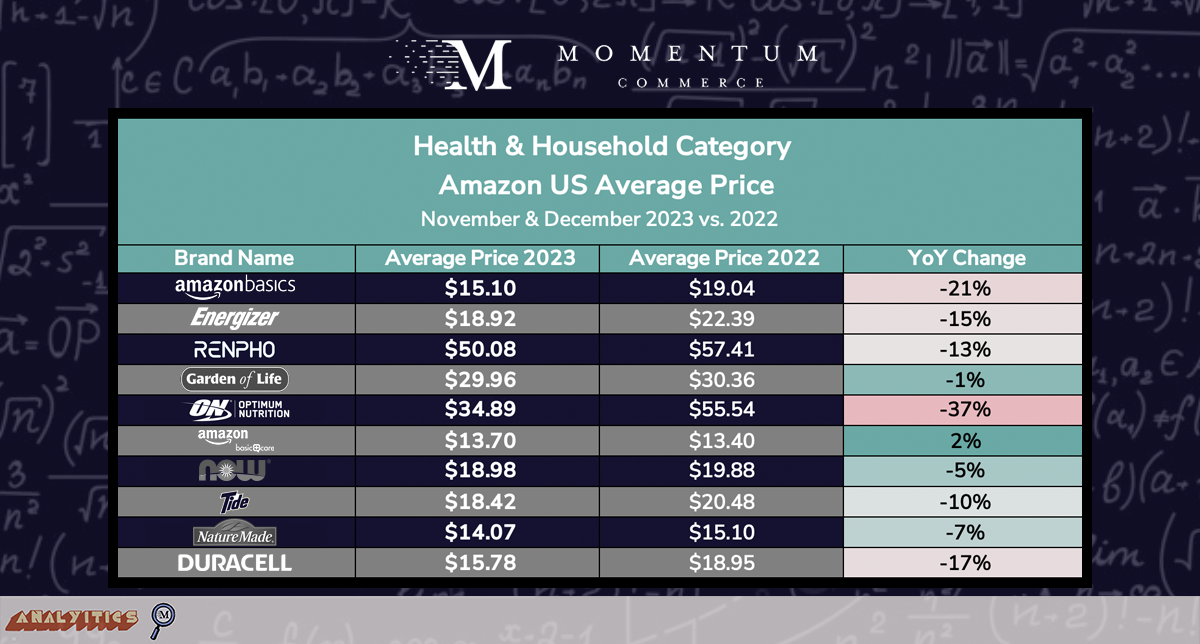
Nine out of the top-10 brands in the Health & Household category on Amazon US had lower average prices YoY during the holiday shopping season. Optimum Nutrition and Amazon Basics demonstrated the steepest price drops, which may have been partially influenced by the increased popularity of smaller pack sizes increasing those products’ prevalence in search results.
Biggest Takeaways for Brands
The wide breadth of products under the umbrella of the Health & Household category on Amazon necessitates brands taking a more nuanced view of pricing in light of each product’s competitive landscape on the search page. Popular products from brands like Energizer and Garden of Life are priced well above their competitors on search, while Now Foods supplements are priced notably below their own competitive set. Monitoring this ‘relative price’ level, especially for popular items, can contribute to more informed decision-making around pricing. This includes conducting tests on price elasticity, enabling the identification of an optimal discount level that positions the product favorably against competitors without significantly diminishing profit margins.
Health & Household Amazon US Branded Search Volume
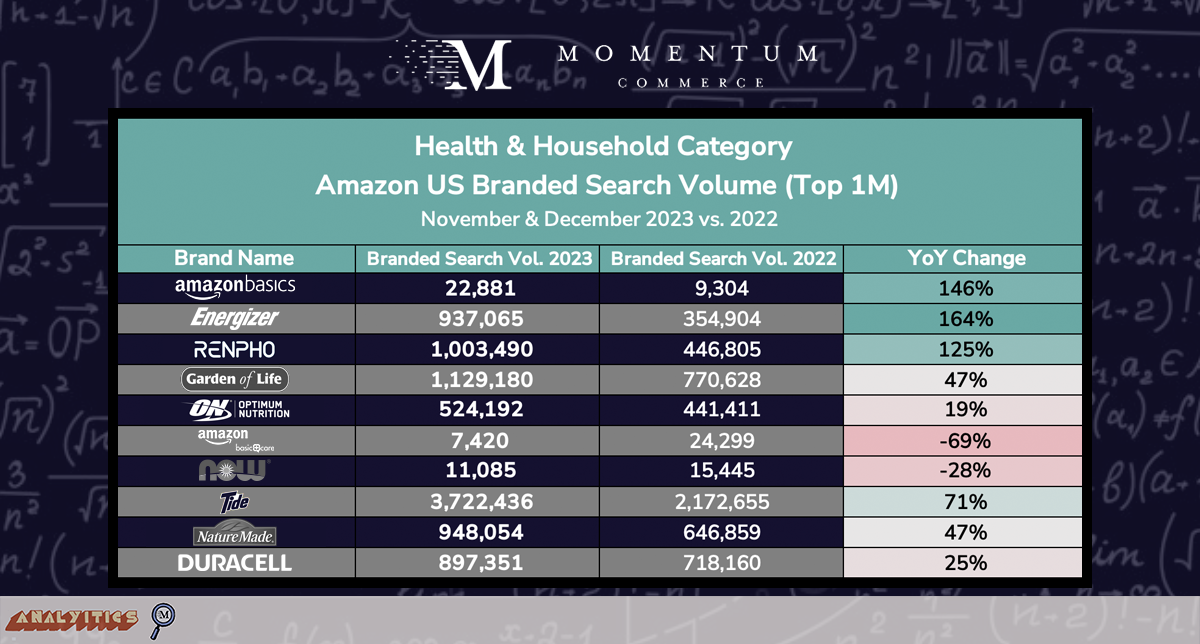
Across eight of the top 10 brands by revenue in the Health & Household category, branded search volume across the top 1 million search terms rose YoY. As mentioned earlier, Health & Household searches involve brand names approximately 19% of the time, a rate higher than in other categories, though it exhibits considerable variation at the subcategory level. This variability is a key factor contributing to the significant fluctuations in the raw number of branded searches among the top studied brands.
Biggest Takeaways for Brands
While driving more branded search traffic is generally a good sign for any brand, particularly in the case of Health & Household, the importance of driving additional branded search through top-of-funnel market efforts needs to be weighed against market dynamics. Two brands that grew branded search significantly, Renpho and Tide, both saw their market share decline over the same period. To inform the importance of upper funnel tactics, brands can examine the rate of branded searches in a given product’s wider subcategory, and then the share of sales coming from branded terms for that same product over a longer period of time. If both of those figures are persistently low, it’s likely more efficient to focus on mid- to lower-funnel tactics like search advertising on high-volume generic terms or PAT campaigns against direct competitors’ products.


